|
Detailing the Execution Flow Section |
  
|
Detailing the Execution Flow Section
|
Detailing the Execution Flow Section |
|
Overview
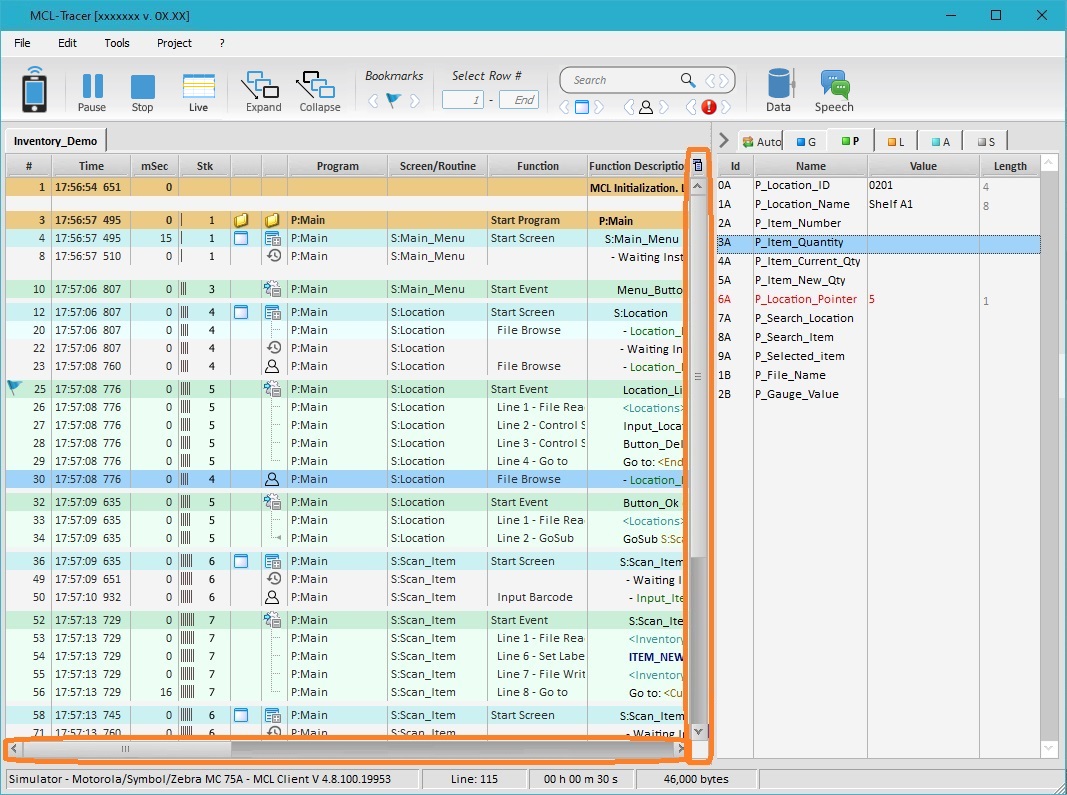
The Execution Flow Section consists of a tab (named after the project) with a table that displays the flow of a project, in real time.
This tab (representing the foreground application) is the default tab.
However, if the project includes Background Procedures, which are called during the session, MCL-Tracer will generate a tab per background procedure to display their execution flow.
Each of these tabs includes the name of the corresponding background procedure and is marked with a ![]() .
.
Operationally speaking, each tab will have its own Execution Flow Section so you can check each element's progression.
This progression is represented by execution lines that contain information to be viewed,analyzed and fed into the Variables Section.
You can copy/paste rows, however, the information contained in the lines of the Execution Flow Section is NOT editable.
The Execution Flow Section of a Tab
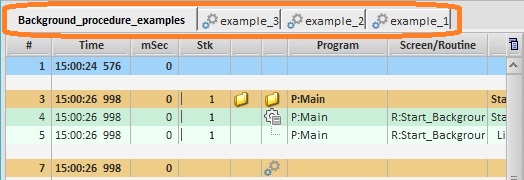
The image below includes 2 tabs (= 2 Execution Flow Sections) - 1 tab for the foreground project (ex: "Background _procedure_examples") and 1 tab for a background procedure that has already been called by the foreground during its execution flow (ex: "example_3")

Execution Flow Table |
|
First row |
Displays the start date/time of the session's log file. |
# column |
Number of the execution line and bookmarks |
Time column |
When each line is executed. |
mSec column |
Time between 1 executed MCL instruction and the next. |
mSec Exe |
Execution time of an MCL instruction. |
Thr column |
N/A |
Stk column |
Program "stack" level. |
Screen column |
Graphic representation of a screen - |
Icons column |
Graphic representation of the element where the actions are being executed. |
Program column |
The name of the program (within the project) where the actions are being executed. |
Screen/Routine column |
The name of the screen or routine where the actions are being executed. |
Event column |
The name of the event associated to the action being executed. |
Function column |
The name of the element being executed (ex: the control, the process). |
Function Description column |
Element detail(s) and parameter(s) associated to the action being executed (referred in the "Function" column). |
Below are the icons that can be displayed in the Icons column of the Execution Flow table that represent a project element.
|
Represents a Program. |
|
Represents a Global Procedure. |
|
Represents a Global Event. |
|
Represents a Background Procedure. |
|
Refers to a Screen with expanded content (its execution lines are visible). |
|
Identifies to a Screen with collapsed content (its execution lines are concealed). |
|
Refers to a physical interaction between Operator and Project. |
|
Represents an Event with expanded content (its execution lines are visible). |
|
Refers to an Event with collapsed content (its execution lines are concealed). |
|
Represents a Routine with expanded content (its execution lines are visible). |
|
Represents a Routine with expanded content (its execution lines are concealed). |
|
Represents a Local Procedure with expanded content (its execution lines are visible). |
|
Represents a Local Procedure with expanded content (its execution lines are concealed). |
|
Identifies a GoSub, a Call or a Return Line process. |
|
Identifies an Exit Line process. |
|
N/A |
|
Identifies an Error occurred during the application flow (ex: a communications error). |
Available Menus
Although the information within the execution lines is NOT editable, it is possible to manage the viewed information (ex: copy/paste of lines, data export, data printing, etc).
The Execution Flow Section provides several menus with options.
The ![]() Menu
Menu
The ![]() button is located on the upper right corner of the Execution Flow Section and provides access to the following option:
button is located on the upper right corner of the Execution Flow Section and provides access to the following option:
|
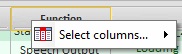
Select columns |
Use this option to define which columns should be displayed. See Column Display. |
The Right-Click Option of the Column Header
If you right-click a column header, the following option opens:
|
Select columns |
Use this option to define which columns should be displayed. See Column Display. |
The Right-Click Menu of a Line
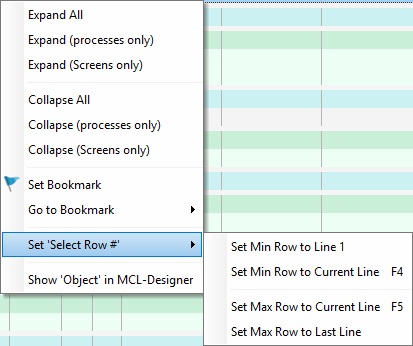
Right-click an execution line to access the following options:
|
Expand All |
Expands all collapsed/hidden lines (regardless of content) within the Execution Flow table. |
Expand (Processes Only) |
Expands the collapsed/hidden lines that relate to processes within the Execution Flow table. |
|
Expand (Screens Only) |
Expands the collapsed/hidden lines that relate to screens within the Execution Flow table. |
|
Collapse All |
Collapses/conceals all possible lines (regardless of content) within the Execution Flow table. |
|
Collapse (Processes Only) |
Collapses/conceals the lines that relate to processes within the Execution Flow table. |
|
Collapse (Screens Only) |
Collapses/conceals the lines that relate to screens within the Execution Flow table. |
|
Previous Occurrence |
Available depending on the element that is right-clicked. Jumps to the execution line with the previous occurrence of the selected element. Ex: Right-click "File Browse"and, then, select "Previous Occurrence" - if there is one, the focus will jump to the line with the previous use of that process. |
|
Next Occurrence |
Available depending on the element that is right-clicked. Jumps to the line with the next occurrence of the selected element. Ex: Right-click "File Browse" and, then, select "Next Occurrence" - if there is one, the focus will jump to the line with the next use of that process. |
|
Highlight 'xxxxxxxxxx' |
Searches and highlights all the occurrences of the selected string 'xxxxxx' in the Execution Flow Section. The string refers to what was previously clicked/selected in the "Program", "Screen/Routine", "Function" or "Function Description" columns. Ex: Click "S:Main_Screen" in the "Screen/Routine" column and, then, select the "Highlight 'S:Main Street' "option - all the "S:Main_Screen" occurrences within the lines of the Execution Flow Section will be highlighted.
To remove the highlighted strings, clear the search box located on the Icons Bar and click "<Enter>". |
|
Search next 'xxxxxxxxxx' |
Searches the next occurrence of the selected string 'xxxxxx' (ex: "S:Main_Screen"). |
|
Set Bookmark |
Applies a bookmark to the selected line. |
|
Clear Bookmark |
Clears the selected line's bookmark. This options is only available if there is a bookmark in the selected line. |
|
Go to Bookmark |
Allows you to "jump" to another bookmark within the Execution Flow Section. The "Previous", "Next" or "Last" options are calculated based on the currently selected line's position. |
|
Set 'SelectRow #' |
Allows you to isolate an area of code for analysis purposes by ONLY displaying a particular set of execution lines. See To Hide/Restore Rows with a Right-Click Menu (or Function Keys) below. |
|
Show 'Object' in MCL-Designer |
Opens the properties window within MCL-Designer V4 of the element included in the selected line. If the selected element has nothing to refer to, the option is greyed out. |
To Hide/Restore Lines with a Right-click Menu (or Function Keys)
|
Set Min Row to Line 1 |
Restores all execution lines above the displayed lines. |
Set Min Row to Current Line |
Marks the beginning of the code area to isolate. |
|
Set Max Row to Current Line |
Marks the end of the code area to isolate. |
|
Set Max Row to End |
Restores all execution lines below the displayed lines. |
Navigation/Display and Info Management
Use the following to navigate the Execution Flow Section, control the display and get more information on the execution lines:
•Execution Flow Section Tabs
By default, any MCL-Tracer session starts with a tab that represents the foreground running project. This tab is identified by that project's name.
If, during the project's progression, a background procedure is called, that creates a new tab to provide that background procedure's execution flow. It is identified by a ![]() icon and the name of the background procedure that was called. If the project under analysis has more than one background procedure and the foreground calls for them, each background procedure will have its own tab.
icon and the name of the background procedure that was called. If the project under analysis has more than one background procedure and the foreground calls for them, each background procedure will have its own tab.
Use the tabs to navigate among the different execution flows and check the different progressions of the foreground application and each background procedure.
•Scroll Bar Navigation
Use the vertical scroll bar to navigate up and down the execution lines.
The horizontal scroll bar becomes visible if the displayed information in an execution line exceeds the available horizontal space of the Execution Flow Section.
•Double-click a Line
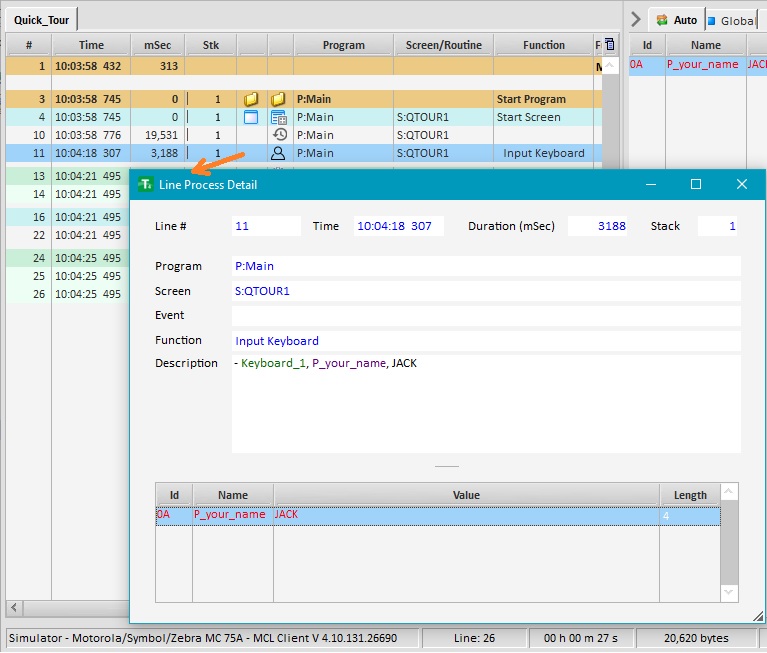
Double-clicking an execution line opens a pop-up window with details on the selected line - the execution time and duration, the stack value, the program/screen/routine it is being executed in, its function, etc. If the execution line contains variables, the variable's ID, name and value at execution time will also be displayed.
•Mouse Over for Information
If you place your mouse over a variable in the "Function Description" column, a pop-up balloon with real time info on the variable is presented. It includes the variable's ID; name and value at that execution time.
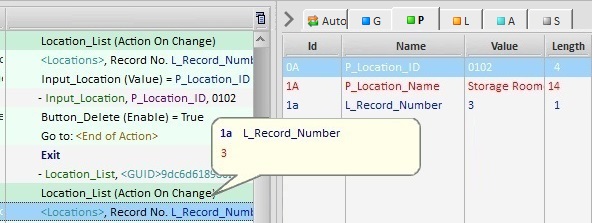
![]() If you want to view the corresponding information on the tabs of the Variables Section (area to the right), you must click the variable.
If you want to view the corresponding information on the tabs of the Variables Section (area to the right), you must click the variable.
It is possible to control the display of the Execution Flow table, meaning, you can define which columns should be displayed and their width:

Use one of the following options to ensure the viewing of a column:
a. Use the ![]() button (located on the Execution Flow table's upper right corner).
button (located on the Execution Flow table's upper right corner).
I. Click ![]() to open a menu.
to open a menu.
II. Mouse over ![]() to open a list with all the table's columns.
to open a list with all the table's columns.
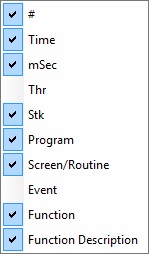
III. Check the columns you want exposed.
b. Use the right-click menu:
I. Right-click a column header to access the corresponding menu.
II. Mouse over the ![]() option to access a list with all the table's columns.
option to access a list with all the table's columns.
III. Check the columns you want exposed.
•Column Width
Use the drag-a-drop to enlarge or reduce a column or the Execution Flow table itself.
1. Mouse over the border of the column or the table.

2. When the cursor changes to a "double-arrow", drag the cursor into the intended direction to enlarge/reduce that area.
![]() This resizing may result in the appearance of a horizontal scroll bar.
This resizing may result in the appearance of a horizontal scroll bar.