|
Detailing the Icons Bar |
  
|
Detailing the Icons Bar
|
Detailing the Icons Bar |
|
Overview
The Icons Bar displays shortcut icons for some of the most common MCL-Tracer commands (which, with the exception of the "Speech" option, are also available in the Options Bar).
 Is used to define the project you want to analyze and the source for its data. It opens a window you must fill in as follows:
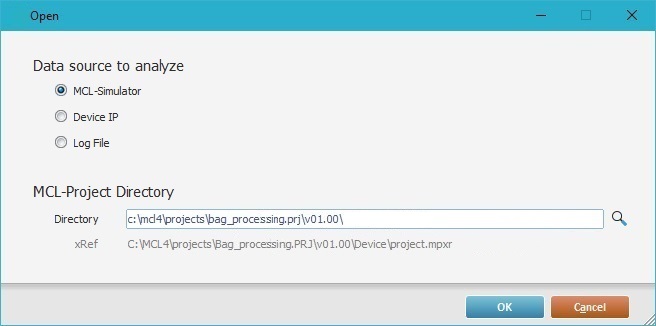
a. Select the source for the project's information:
•"MCL-Simulator" - (default option) Check this option, if you want to analyze a project that is running in the MCL-Simulator.
•"Device IP" - If you want to analyze a project running in a device, check this option. In this case, a new option ("IP") becomes visible so you can enter that device's IP.
![]() When checking the "Device IP" option, consider the following:
When checking the "Device IP" option, consider the following:
If you intend to use a a Windows CE device with a USB connection, the connection must be configured in RNDIS mode. If this is not possible (option NOT available in the Windows CE device or the Windows Mobile Device Center), you must use a valid IP, meaning, an IP from an Ethernet or Wireless connection to ensure a successful connection to MCL-Tracer.
![]()
Make sure the targeted device includes the project you defined as project source ("File" option).
•"Log File" - Check this option to analyze a project's log file. Use ![]() to open the intended project's folder and locate it.
to open the intended project's folder and locate it.
b. Select the project you intend to analyze in the "Directory" box. Click ![]() to browse for the intended project's ".mprx" file (located in the project's folder).
to browse for the intended project's ".mprx" file (located in the project's folder).
![]()
MCL-Tracer uses an ".mpxr" file. This file is only created when you generate the MCL application within MCL-Designer V4.
Use one of the following, to trigger the creation of your project's ".mpxr" file:
a. Perform a direct "generate" operation. Click the "Generate" icon (in MCL-Designer's Icon Shortcut Bar) OR click the "Generate" option (located in the "Project" menu of MCL-Designer's Menu Bar) OR use the corresponding <F6> shortcut key.
b. The launching of MCL-Simulator generates the MCL application. Click the "Simulate" icon (in MCL-Designer's Icon Shortcut Bar) OR click the "Simulate" option (in the "Project" menu of MCL-Designer's Menu Bar) OR use the corresponding <F7> shortcut key.
c. The loading of your project into a device also generates the MCL application. Click the "Load" icon (in MCL-Designer's Icon Shortcut Bar) OR click the "Load to Device" option (in the "Project" menu of MCL-Designer's Menu Bar) OR use the corresponding <F8> shortcut key.
c. Click ![]() to apply or
to apply or ![]() to abort the operation.
to abort the operation.
This icon has two states:
|
This icon state represents a running MCL-Tracer session. |
|
These intermittent icons correspond to an MCL-Tracer session that is currently paused. |
 /
/ These buttons are used to interrupt/resume an MCL-Tracer session.
When you launch MCL-Tracer, it, automatically, starts a session/log file. To pause an MCL-Tracer session means that anything you execute in MCL-Simulator or the device during that time is not logged, viewed in the Execution Flow Section or stored in a log file.
This button is ONLY available if the MCL-Tracer session is running. Since the session starts, automatically, as soon as MCL-Tracer is launched/a source is defined, this button is available from the start. Once you click it to set the session to stand-by, this button is replaced by the "Resume" button.
This button is ONLY available if the MCL-Tracer session has been paused. Use it to resume the session - the Execution Flow Section will continue from the last generated execution line and display/log what is executed in the MCL-Simulator/the device.
![]() Regardless of you pausing/resuming the session, the corresponding log file is still the same.
Regardless of you pausing/resuming the session, the corresponding log file is still the same.
 /
/ These buttons are used to end the current MCL-Tracer session (closing the corresponding log file) and to start a new session (and generate a new log file).
This button stops the MCL-Tracer session and closes the corresponding log file. Once clicked, this button is replaced by the "Start" button.
As a result, the "Pause" button becomes inactive/is greyed out.
This button is ONLY available after you have stopped the MCL-Tracer session (launching MCL-Tracer automatically starts a session).
Click it to start a new session and generate a new log file. When you click this option, any information regarding a previous session is cleared.
![]() Whenever you stop and start an MCL-Tracer session, it generates a new log file.
Whenever you stop and start an MCL-Tracer session, it generates a new log file.
 This button represents the "Live" mode - a row selection mode that forces the selection of the last row to be executed, meaning, if you activate it, the focus will immediately go to the last row of the Execution Flow Section, which is running in real time. You can select a different row, while in active "Live" mode but, as soon as another row is generated (ex: because the application resumes its execution), the focus goes back to the last row.
Check the displayed icon to know if the "Live" mode is active or not. Depending on its current mode, clicking the "Live" button will set the opposite mode for the execution flow.
Inactive "Live" mode |
Active "Live" mode |
|
|
![]()
Depending on the row selection mode for the Execution Flow Section (inactive/active "Live" mode), it will affect the Variables Section:
without a "Live" mode - the displayed variables/values refer to the selected row.
with an active "Live" mode - the displayed variables/values refer to the last row since this mode "forces" the selection of the last row being executed in the Execution Flow Section.
To revert to an inactive "Live" mode, click ![]() .
.
 Is used to open any closed/grouped execution rows within the Execution Flow Section.
If a screen includes collapsed rows, it is identified with a ![]() . Events with collapsed rows are marked with a
. Events with collapsed rows are marked with a ![]() .
.
 Is used to hide/group execution rows within each screen and events. The screens/events without collapsed rows (a full display) are identified by the corresponding
 ![]() /
/![]() .
.
![]() Both options ("Expand" and "Collapse") affect all the rows of the Execution Flow Section.
Both options ("Expand" and "Collapse") affect all the rows of the Execution Flow Section.
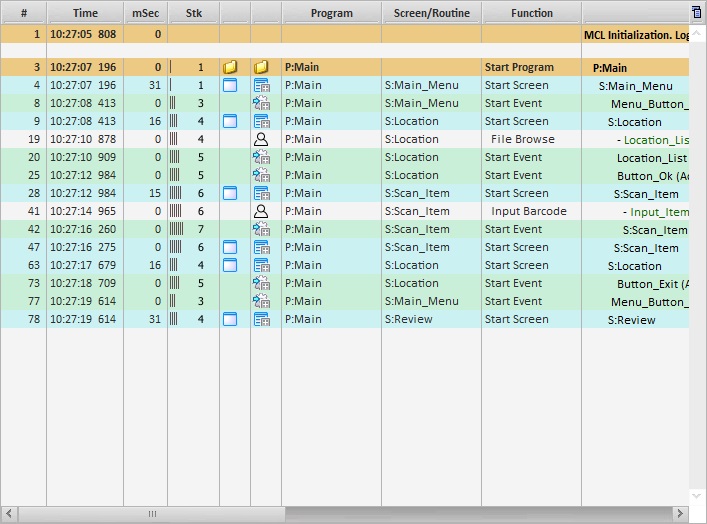
An Expanded View of the Execution Flow Section |
A Collapsed View of the Execution Flow Section |
|
|
![]() Used to create bookmarks (or "points of interest") in the application's execution flow that you can jump to.
Used to create bookmarks (or "points of interest") in the application's execution flow that you can jump to.
Navigation between Bookmarks |
|
|
Click the central "flag" to define a bookmark in the selected row of the execution flow. See Setting a Bookmark. |
|
Click the arrow to the left to navigate to the previous bookmark. |
|
Click the arrow to the right to navigate to the next bookmark. |
![]() You can also jump to the desired bookmark by right-clicking anywhere in the Execution Flow Section, selecting "Go To Bookmark" and, then, selecting "First", "Previous", "Next" or "Last" (the "Previous", "Next" or "Last" positions relate to the currently selected row).
You can also jump to the desired bookmark by right-clicking anywhere in the Execution Flow Section, selecting "Go To Bookmark" and, then, selecting "First", "Previous", "Next" or "Last" (the "Previous", "Next" or "Last" positions relate to the currently selected row).

Example of Bookmarks
|
This example includes 5 bookmarks placed in rows 1, 4, 15, 26 and 40.
|
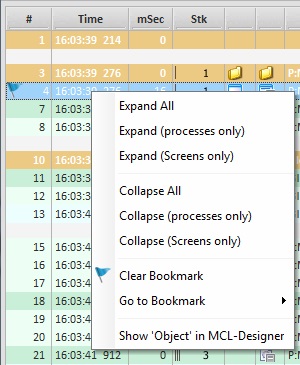
Use one of the following methods to place a bookmark:
•Click to the left of the intended row's row number.

•Select the row you want to add a bookmark to and, then, click ![]() in the Icons Bar.
in the Icons Bar.
•Use the right-click menu available In the Execution Flow Section:
1. Right-click the row you want to add a bookmark to.

2. In the resulting menu, select "Set Bookmark".

The bookmark is placed in the selected row (to the left of the row number).

Use one of the following methods to remove a bookmark from the Execution Flow Section:
•Click the bookmark ![]() you want to remove.
you want to remove.

•Select the row with the bookmark you want to clear and, then, click ![]() in the Icons Bar.
in the Icons Bar.
•Use the "right-click menu" available In the Execution Flow Section:
1. Right-click the row with the bookmark you want to remove.
2. In the resulting menu, select "Clear Bookmark".
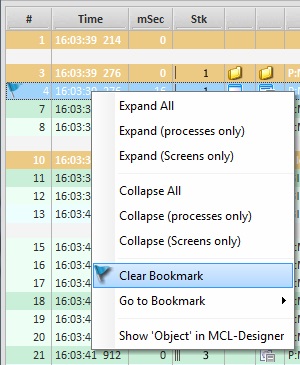
The bookmark is removed from the selected row.
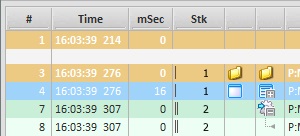
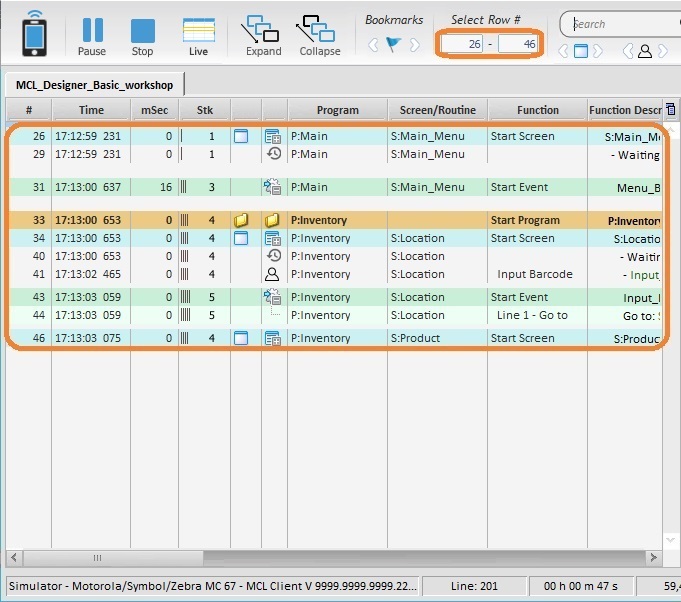
The "Select Row #" tool is used for analysis purposes - it highlights a particular set of execution rows by graying out all the others.
Example of Highlighted Rows with the Use of the "Select Row #" Tool
|
•Rows 25 to 47 have been selected in the "Select Row #" option (in the Icons Bar) - the rows are visible.
•All other rows are grayed out. |
To Select Rows with "Select Row #"
Step-by-step
1. In the "Select Row #" option's left box, enter the row number that refers to the beginning of the selection (ex: 3).
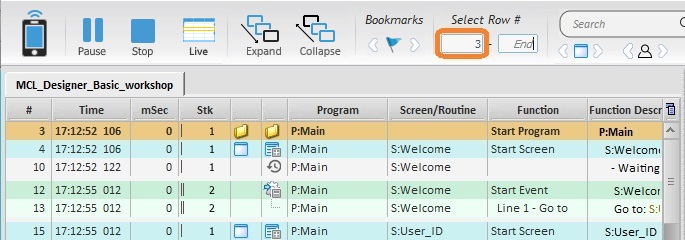
2. Press “<Enter>” in your PC keyboard.
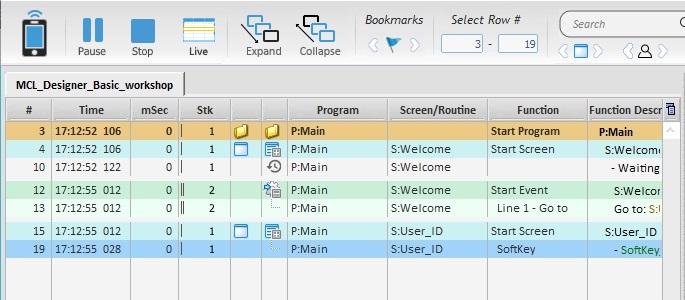
3. In the "Select Row #" option's right box, enter the row number that refers to the end of the selection (ex: 19).
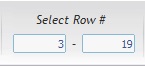
4. Press “<Enter>” in your PC keyboard.
Every row in the Execution Flow Section is now grayed out except for rows 3 to 19.
To Clear the "Select Row #" Selection
To deselect the rows, simply clear the "Select Rows #" boxes and press "<Enter>" in your PC keyboard to apply.
Search Tool/Navigation Buttons
General Search |
|
|
Is used to search a particular string (variable value/name, screen or control name) in the Execution Flow Section. |
|
(Previous/Next) Only available within a search context. Use these buttons to go to the previous row or the next row with the searched string. The starting point is the initial row with the matched string. |
Navigate between Screens |
|
|
Use this button to navigate to the 1st screen. |
|
Use this button to navigate to the previous screen. |
|
Use this button to navigate to the next screen. |
Navigate between Operator Inputs |
|
|
Use this button to navigate to the 1st operator input. |
|
Use this button to navigate to the previous operator input. |
|
Use this button to navigate to the next operator input. |
Navigate between Errors |
|
|
Use this button to navigate to the 1st "Last Command Return Code" with value "1" (system variable 99=1). |
|
Use this button to navigate to the previous "Last Command Return Code" with value "1" (system variable 99=1). |
|
Use this button to navigate to the next "Last Command Return Code" with value "1" (system variable 99=1). |
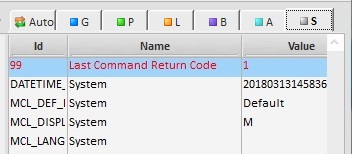
Example of a "Last Command Return Code = 1" error
|
This window refers to the "System" tab which is displaying a specific error:
A "Last Command Return Code" error has occurred related to the system variable with the ID "99" and that contains "1" as a value. |
 Is used to open a "Data Viewer" window that includes the MCL Designer project's data files and local database tables. This window allows you to view the content of the listed files/tables.
The "Data Viewer" organizes these files into a Tree View (located to the left of the window) and it also includes a Preview area (to the right) that displays the content of the file/table selected in the Tree View.
![]()
This option is only available for MCL-Tracer analysis in a simulator environment, meaning, it can ONLY be used when the project is running within MCL-Simulator.

The Tree View organizes the existing files into 2 major groups:
•Data Files (includes all the data files used in an MCL-Designer project. See How to Work with Data Files.
•Local Database (contains the Local Database tables that have been created in the project. See How to Work with a Local Database.
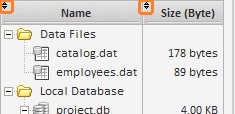
The Tree View area provides the following information on the listed files:
Name column |
Displays the name of each group ("Data Files" and "Local Database") and the name of the listed files and tables. The listed data files that have been created in the "Data Files" module but have not been applied to the current project's workflow have their name in uppercase. Ex: "STOCK.DAT". |
Size (Byte) column |
Refers the size (in bytes) of the corresponding file. |
Directory column |
Displays the path to where the file/table is stored. |
Last column |
Refers the date of the last file/local database update. |
When an element in the Tree View is selected, its content is displayed in the Preview area, to the right.
The Preview area displays info on the file/table selected in the Tree View area as well as its content.
Example of a data file preview:
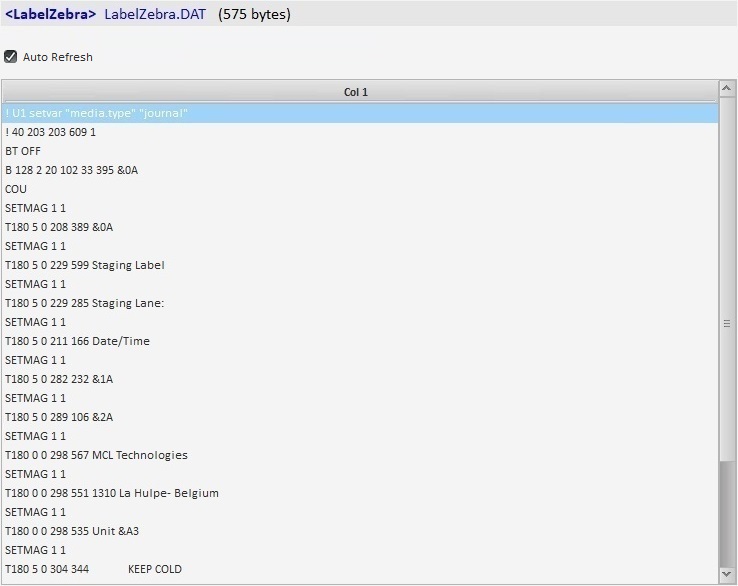
If you have selected a data file in the tree view, the top bar provides the file's alias, name and size. Ex: "<LabelZebra> LabelZebra.DAT (575 bytes)".
If the selected element is a local database table, the top bar displays the table's name and path. Ex: "Table_1 (\project_1\data\project.db".
There is an "Auto Refresh" option, which is checked by default, to ensure the update of the displayed data file information and content.
This option is ONLY available if you select a data file in the tree view.
This information update relates to the input executed in a specific simulation environment - via MCL-Simulator. If you have uploaded the project onto a device for testing, the Auto or Manual Refresh does NOT apply.
If you want to control the update of the previewed data file content, uncheck the "Auto Refresh" option and use the ![]() button that becomes available whenever you want to refresh the displayed data.
button that becomes available whenever you want to refresh the displayed data.
In the case of local database tables, the Refresh related options are replaced with an "SQL" box.
Below is a box that displays the actual content of the file/table selected in the Tree View area.
•Data File Selection
Once you select the intended file in the Tree View area, you, immediately, view its details in the Preview area.
At the top, you have the file's alias, name and size and below is its content.

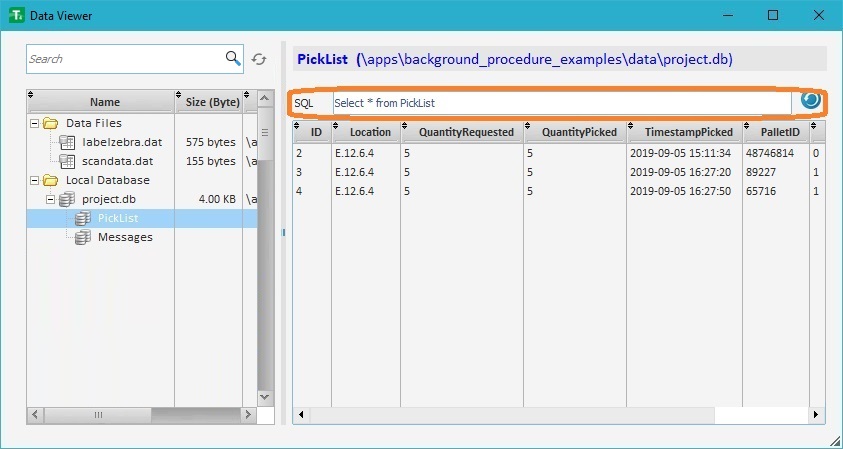
•Local Database Table Selection
When selecting a Local Database table, an "SQL" box where you can define the intended SQL commands becomes available.
The default SQL command "Select * from" is automatically filled in with the name of the selected table and applied. As a result, you can view its content.
Use the "SQL" box to enter the intended SQL command and click the ![]() button next to it to execute that command.
button next to it to execute that command.
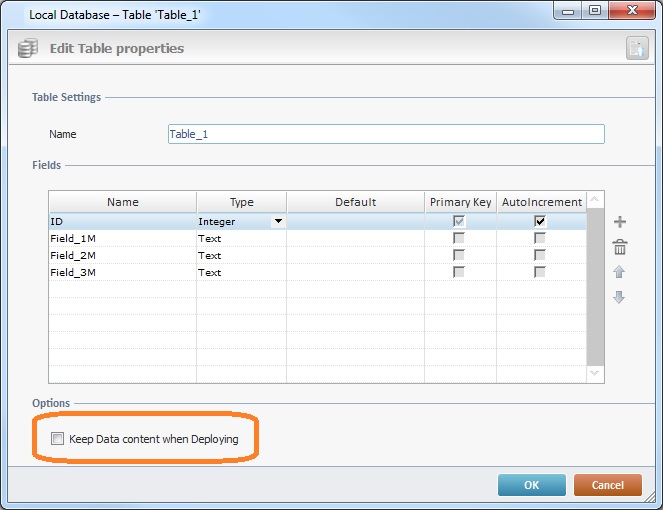
![]()
To be able to view the content of a table in "Data Viewer", you must check the option "Keep Data content when Deploying" (located in the table's properties window).
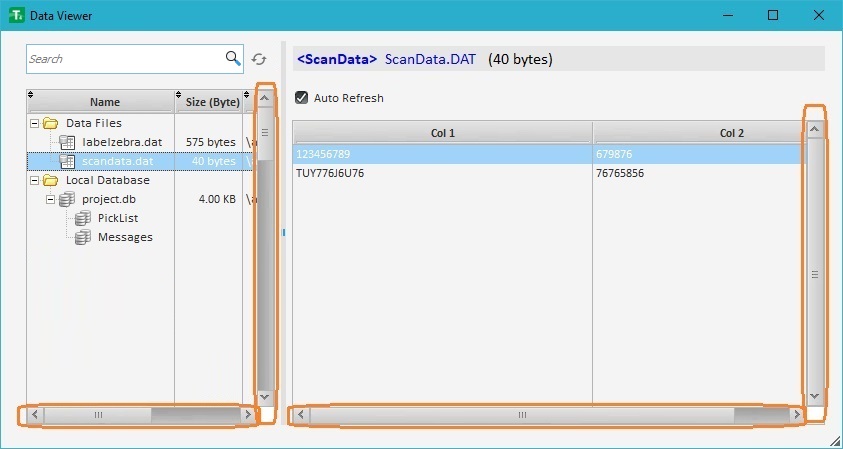
•Scroll Bars
When available, use the horizontal and/or vertical scroll bars to navigate the two areas.
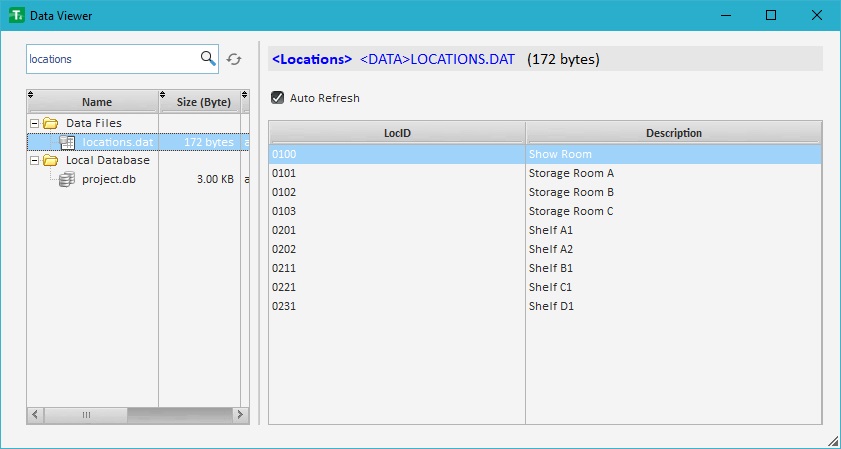
Use the filter box to search for a file in the Tree View. Enter the full or partial name of the file(s) you want.
The tree view display will, immediately, be filtered to only show the files that fit the entered value.
Ex: As the value "locations" was entered into the filter box, the tree view display was, automatically, changed to only show the "locations.dat" file.
|
|
|
The Preview area does not refresh its content for this filter operation - select one of the filtered data files to view its content.
To return to a full tree view display,just empty the filter box.
•Area Width
Mouse over the dividing line between both areas and, when the cursor changes to an arrow, drag it to the intended direction to enlarge or reduce one of the areas.
•Column Width
Mouse over the intended column border and when the cursor changes into an arrow, drag it into the intended direction to enlarge/reduce that column.
Ex: 2 Column types:
![]()
![]()
•Column Sorting
Use the ![]() of the tree view's columns to sort the displayed items in an ascending or descending order, as required:
of the tree view's columns to sort the displayed items in an ascending or descending order, as required:
 Is used to open a window containing the operator's "speech dialogs".
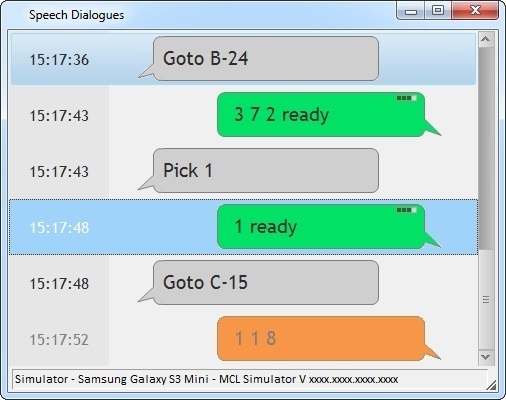
Example of a Speech Dialog
|
This window includes the following information:
•The speech input (what the operator says) and output (what the operator hears) that occurred within the project. Use the following to identify/understand the input/output info: ✓The pointer of the dialog balloon indicates the output and the input speeches - pointer to the left refers to output speech and pointer to the right represents input speech. ✓The color gray is associated to output speech. ✓The color green represents an acceptable/recognizable speech input. ✓The color orange refers to a rejected speech input. ✓The icon on the dialog balloon's upper right corner displays the confidence level of the input speech.
•The timestamp for each speech input/output.
•The source for the displayed information: Simulator - if the project is running in the "MCL-Simulator". Device IP - if the project is running in a device. Log file name - if you are running a log file.
•The model of the project's target device.
•The source's SW version The MCL-Simulator's version The device's MCL-Client version Not applicable when using a log file. |