|
MCL-Tracer |
  
|
MCL-Tracer
|
MCL-Tracer |
|
Overview
MCL-Tracer is a useful tool for project flow analysis and debugging. It can be launched from MCL-Designer (ex: the project is run within MCL-Simulator) or it can stand alone (ex: the project is uploaded and run within a device).
This tool displays the application's flow, in real time and exposes the visible elements (screens, controls) as well as the background elements involved (processes, actions, associated variables, etc.). It also allows you to view the program stack level that is generated during project execution. See Program Stack Level below.
MCL-Tracer requires an MCL-Client (= runtime) with a running project, so, you must either run it through a simulator (MCL-Simulator) or load it into a device and use the project.
Program Stack Level
An MCL application is based on processes, local/global procedures and actions. The execution of most of these elements (ex: the Branch “GoSub”, the “Start External Program”, the “Start MCL-Program” processes, the “Click” action, etc.) increases/decreases the stack level.
Usually, stacks MUST be closed manually, one by one. Some stacks, however, are created by MCL-Client or MCL-Runtime for internal control purposes and are managed (opened and closed) automatically.
The elements that open a stack that must be closed manually, by the developer, include the following warning:
![]()
This means that the called element must end its execution with a "Go To <Exit>" or a "Go To <End of GoSub>" process to close the stack.
Example of Stack Level Evolution
1. The Menu Button control (which includes a “GoSub” process, by default), always generates +3 stacks which are displayed by MCL-Tracer:
+1 internal stack (managed automatically);
+1 stack representing the "GoSub" process;
+1 stack representing the Menu Button itself (due to the control's nature).
2. Once a Branch "GoTo <Exit>" process is triggered, all 3 stacks are closed.
![]()
A "Go To: Screen" process that is called from a Local/Global Procedure does NOT generate an additional stack.
To Access MCL-Tracer
MCL-Tracer can be used within MCL-Designer V4, to test a project or you can use it to analyze a project that has been loaded into a device.
•Use one of the following to open MCL-Tracer within MCL-Designer V4:
a. In the Menu Bar, click "Project" and, then, the "MCL-Tracer" option.
b. Use the "Shift+F7" keyboard keys.
c. Click the "Shift" keyboard key and right-click ![]() (located in the Icon Shortcut Bar).
(located in the Icon Shortcut Bar).
Whatever the selected option, both the MCL-Simulator and the MCL-Tracer are launched displaying the currently open project.
You can only use the MCL-Simulator and the MCL-Tracer tools if there is an open project.
•If you intend to analyze a project that is running in a device without having an open MCL-Designer session, you must call MCL-Tracer from the MCL-Designer V4 installation folder (default location is \MCL4\Designer\Bin) by executing the "MCL-Tracer.exe" file. Once the resulting session is open, select the source for the data to be analyzed by MCL-Tracer - select "device" as a data source and specify its IP to establish the connection. See File Menu.
Before executing MCL-Tracer, make sure the intended project is open and running in the device.
This procedure does not launch MCL-Simulator.
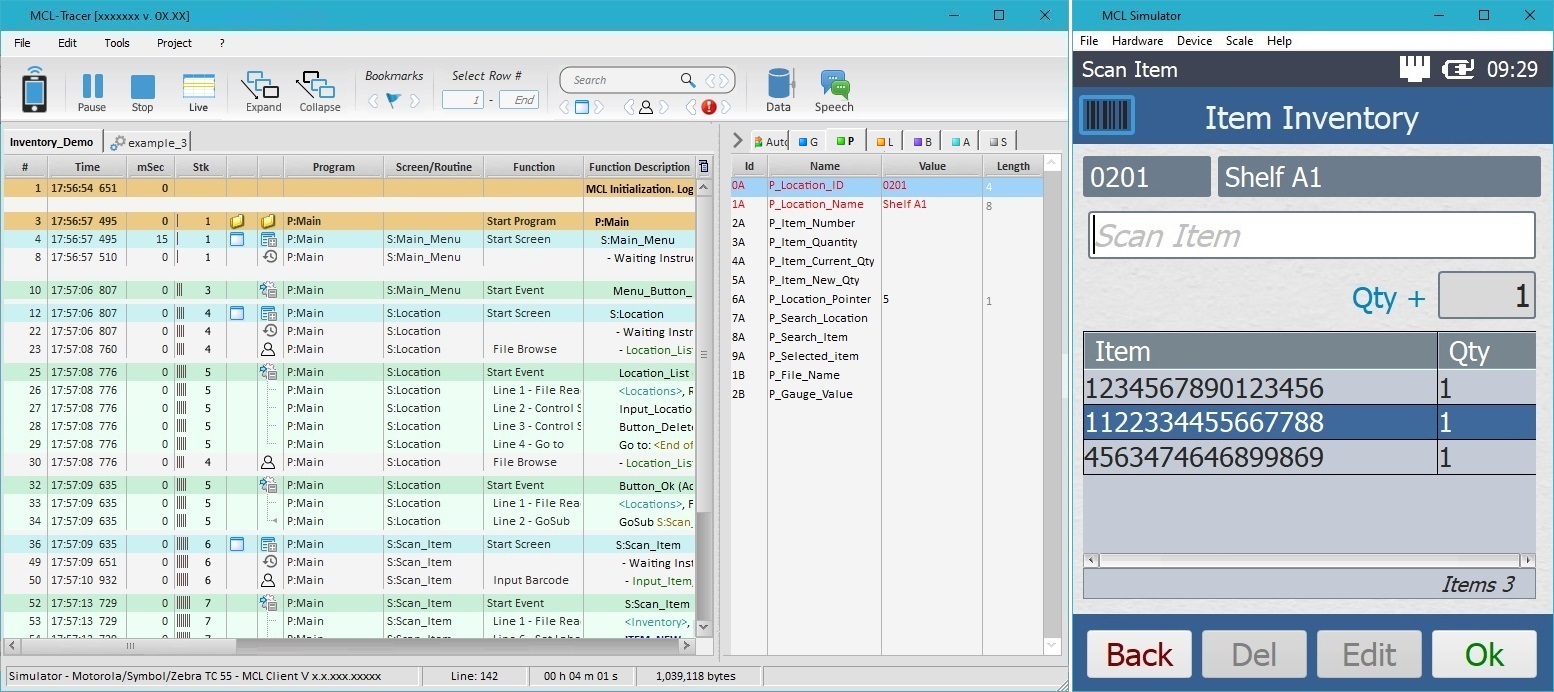
MCL-Tracer's Work Area
The image below indicates the 4 main sections of MCL-Tracer.
A – Menu Bar Section
D – Status Section

The Menu Bar Section consists of 2 bars:
An Options Bar that includes a series of drop-down menus that provide access to common functions such as opening projects or Help. See Detailing the Options Bar.
An Icons Bar that provides the following options:
•graphical representations of commonly used project analysis functions;
•a search tool to search for a particular string (ex: variable value/name, screen or control name) in the Execution Flow Section;
•navigation buttons to navigate the Execution Flow Section after a search (the starting point is the selected row/search result);
•a Data Viewer that lists the data files and the local database's tables used in the project being analyzed so you can check their content;
•a Speech Dialog Viewer that displays the device operator's speech input and the application's output.

By default, the Execution Flow Section displays the execution flow of a running project in real time. The available logical elements (ex: running programs, screens, controls, actions, processes, etc.) are organized into a table.
If a background procedure is called by the main flow, a secondary tab with its own Execution Flow Section is created to display its execution flow - 1 tab per running background procedure). The tabs that handle background procedures are marked with a ![]() and refer the name of the corresponding background procedure.
and refer the name of the corresponding background procedure.
See Detailing the Execution Flow Section.

The Variables Section displays the variables being used within the running project - Global, Program ("Pgm"), Local, Background ("Bkgrd"), Application Parameter ("App") and System - and the values they contain. This section is organized into tabs (a tab per variable type + "Auto" tab).
See Detailing the Variables Section.
![]()
The Status Section is divided into several areas, giving the following information:
Ex: Simulator - Motorola/Zymbol/Zebra MC 75A - MCL Simulator V 4.4.56.9003
•The source for the running project: "MCL-Simulator" - if the project is running in the simulator. An IP - if the project is running in a device. The name of the log file - if you are analyzing an MCL-Tracer Log File (an automatically generated file for each MCL-Tracer session).
•The target device manufacturer and model.
•Depending on the source, refers to the SW version of the simulator or the device. |
Ex: Line: 47
Selected execution row. |
Ex: 00 h 00m 11 s
Execution time of the current project. |
Ex: 16.206 bytes
The size of the MCL-Tracer Log File.
MCL-Tracer Log File a file which is automatically generated every time you open an MCL-Tracer session and is stored in the current project's "Tracer" folder. |